| Computer Graphics Forum (CGF) |
|
On Visualizing Continuous Turbulence Scales |
|
Xiaopei Liu1, Maneesh Mishra2, Martin Skote3, and Chi-Wing Fu4 |
|
Computer Graphics Forum (CGF), 38(1):300-315, 2019, presented at EuroVis 2019 |
|
1. ShanghaiTech University |
|
|
|
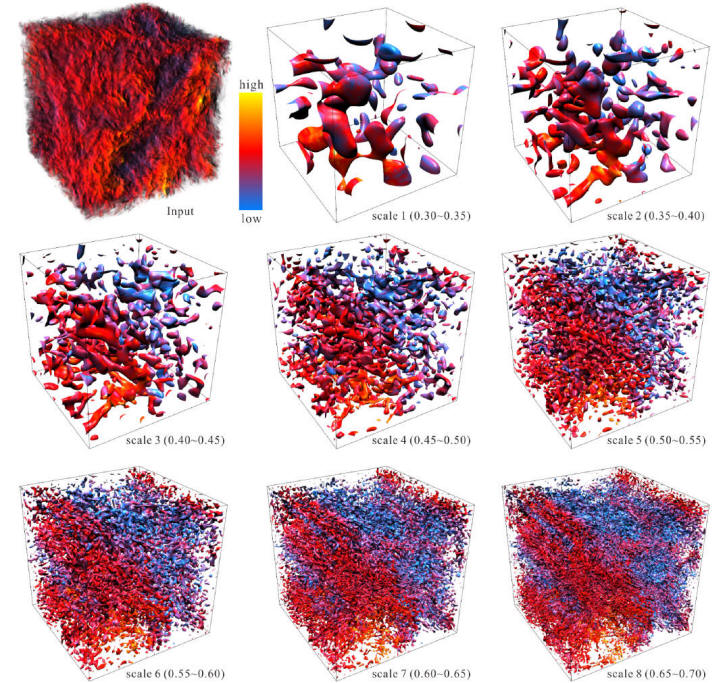
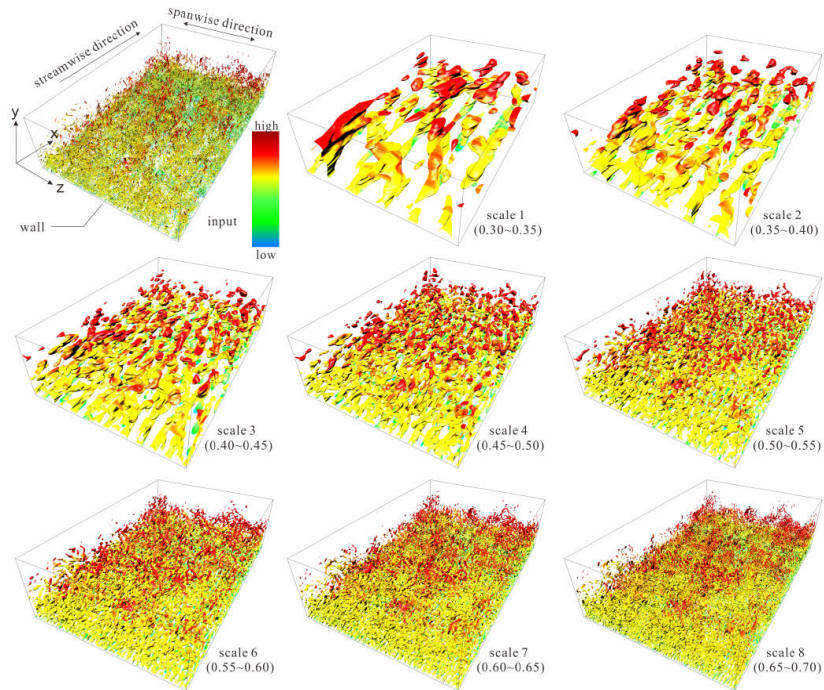
Abstract Turbulent flows are multi-scale with vortices spanning a wide range of scales continuously. Due to such complexities, turbulence scales are particularly difficult to analyze and visualize. In this work, we present a novel and efficient optimization-based method for continuous-scale turbulence structure visualization with scale decomposition directly in the Kolmogorov energy spectrum. To achieve this, we first derive a new analytical objective based on integration approximation. Using this new formulation, we can significantly improve the efficiency of the underlying optimization process and obtain the desired filter in the Kolmogorov energy spectrum for scale decomposition. More importantly, such a decomposition allows a “continuous-scale visualization” that enables us to efficiently explore the decomposed turbulence scales and further analyze the turbulence structures in a continuous manner. With our approach, we can present scale visualizations of direct numerical simulation data sets continuously over the scale domain for both isotropic and boundary layer turbulent flows. Compared with previous works on multi-scale turbulence analysis and visualization, our method is highly flexible and efficient in generating scale decomposition and visualization results. The application of the proposed technique to both isotropic and boundary layer turbulence data sets verifies the capability of our technique to produce desirable scale visualization results.
|
|
|||
|
|
||||